
Review your notes.
Click a passage to open its comment and worked example.
8.2 · Least squares regressionPage 317
OpenIntro Statistics, fourth edition · CC BY-SA 3.0David Diez, Mine Çetinkaya-Rundel & Christopher Barr. Original page; our highlights and comments are added.
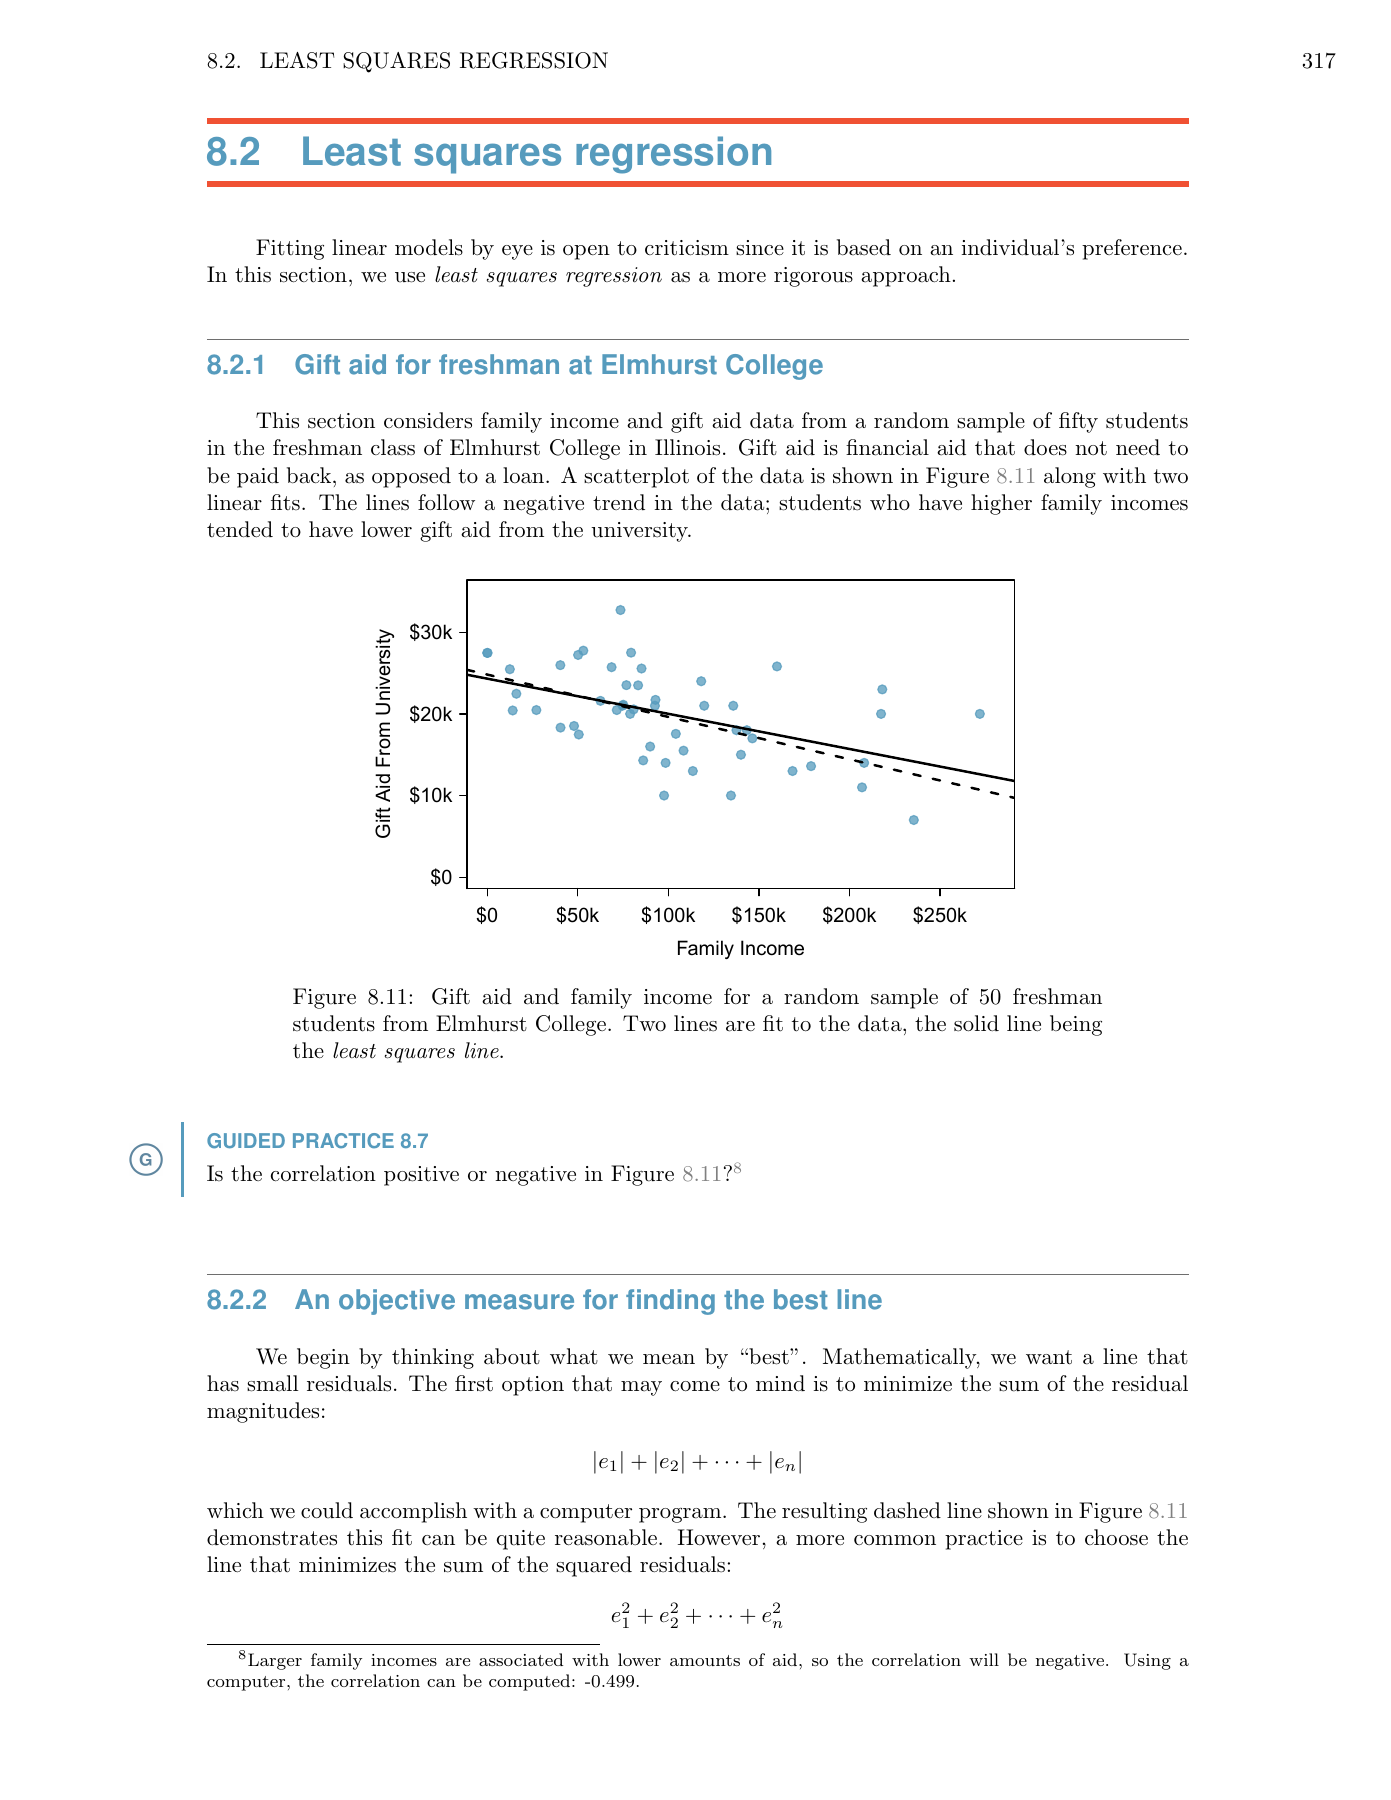
The page compares family income with gift aid for 50 students. Higher income tends to accompany lower aid; the reported correlation is −0.499.
Student 1: income is 8.86k below average; aid is 1.78k above average. The opposite signs contribute negatively to r.
Correlation r = −0.499A downward association, not a claim about causation.
How these points become a correlation
Subtract each variable’s average from every observation. Multiply the two deviations for each student, then add the 50 products. Opposite signs pull that sum down; matching signs pull it up.
Divide by the two variables’ total spread to get a unit-free value between −1 and 1. Here r ≈ −0.499 indicates a moderate negative linear association. It does not mean aid falls by 49.9%, or establish what causes that association.
A direct foundation for reading the pattern in this figure.
A residual is observed aid minus predicted aid. Taking its absolute value measures the size of the miss without letting positive and negative misses cancel.
Practise predictions, signed errors and their interpretation.
Squaring gives larger misses more weight. The solid line in the figure minimises this total across the same 50 observations.
Learn how an error becomes the objective used to fit a line.